
Degen Data Deep Dive
Statistical Arbitrage — Part III: Investigating Past Performance
The Statistical Arbitrage Series is a collaboration between Vertox and BowTiedDevil to present stat arb strategies and their application on a blockchain environment.
Entries in the series will be written by a single author, however the series will be available in full on both publications.
About Vertox
Vertox is a quantitative researcher from Germany who started learning about quantitative finance at the age of 14 and hasn’t stopped since.
His publication VertoxQuant covers all things quantitative finance. From simple momentum trading all the way to complex strategies involving stochastic calculus and market making.
About BowTiedDevil
BowTiedDevil is a lifelong techie who discovered the magic of computers by playing MS-DOS games on the family PC (a 286-DX). He learned how to write simple programs in BASIC, then C. He discovered the world of open source software from a Mandrake Linux CD included in a magazine.
His Ethereum bot-building experiments in 2021 were fruitful, so he began writing regularly at Degen Code where he focuses on the development of Ethereum trading bots using Python.
Foundations
This post is primarily authored by BowTiedDevil.
In Part II, Vertox laid out the fundamentals of the strategy and demonstrated how to optimize the return for a randomized mean-reverting process.
Using artificial data is good as a starting point, but we should not expect the behavior for a real liquidity pool to match it.
In this exercise we will identify a real pool, extract price data directly from the chain, and feed that price data into the same evaluation done in Part II.
Finally we will evaluate the data to determine whether the particular opportunity is worthwhile.
Chain Data (High Level)
The Statistical Arbitrage Series has two audiences, so I will simplify concepts where possible.
I have shown how to extract data from a given blockchain many times. If you want to know more, I recommend reviewing past entries on the topic:


Cryo
My tool of choice for data extraction is Cryo. Development on it has stalled, but the last release (0.3.2) works just fine. I recommend using the cargo installation method described in the Github repository README.
Parquet
I prefer to use the Apache Parquet format for storing the extracted data. Cryo can extract to this format natively.
Polars
Python has many tools for working with Parquet data. The most commonly used tools are Polars and Pandas. Both can load and transform our Parquet data into a DataFrame, then perform operations on it.
I prefer to use Polars, but concede that Pandas is the more familiar tool for quants and data science types. Feel free to substitute Pandas or use the built-in Polars → Pandas translation methods to get the data to a format that you can manipulate comfortably.
Picking A Pool
We will use the Uniswap app interface to identify a stablecoin pool. There are other ways, but this is the simplest.
Part II used a hypothetical DAI-USDC pool, so we’ll look for an onchain match.
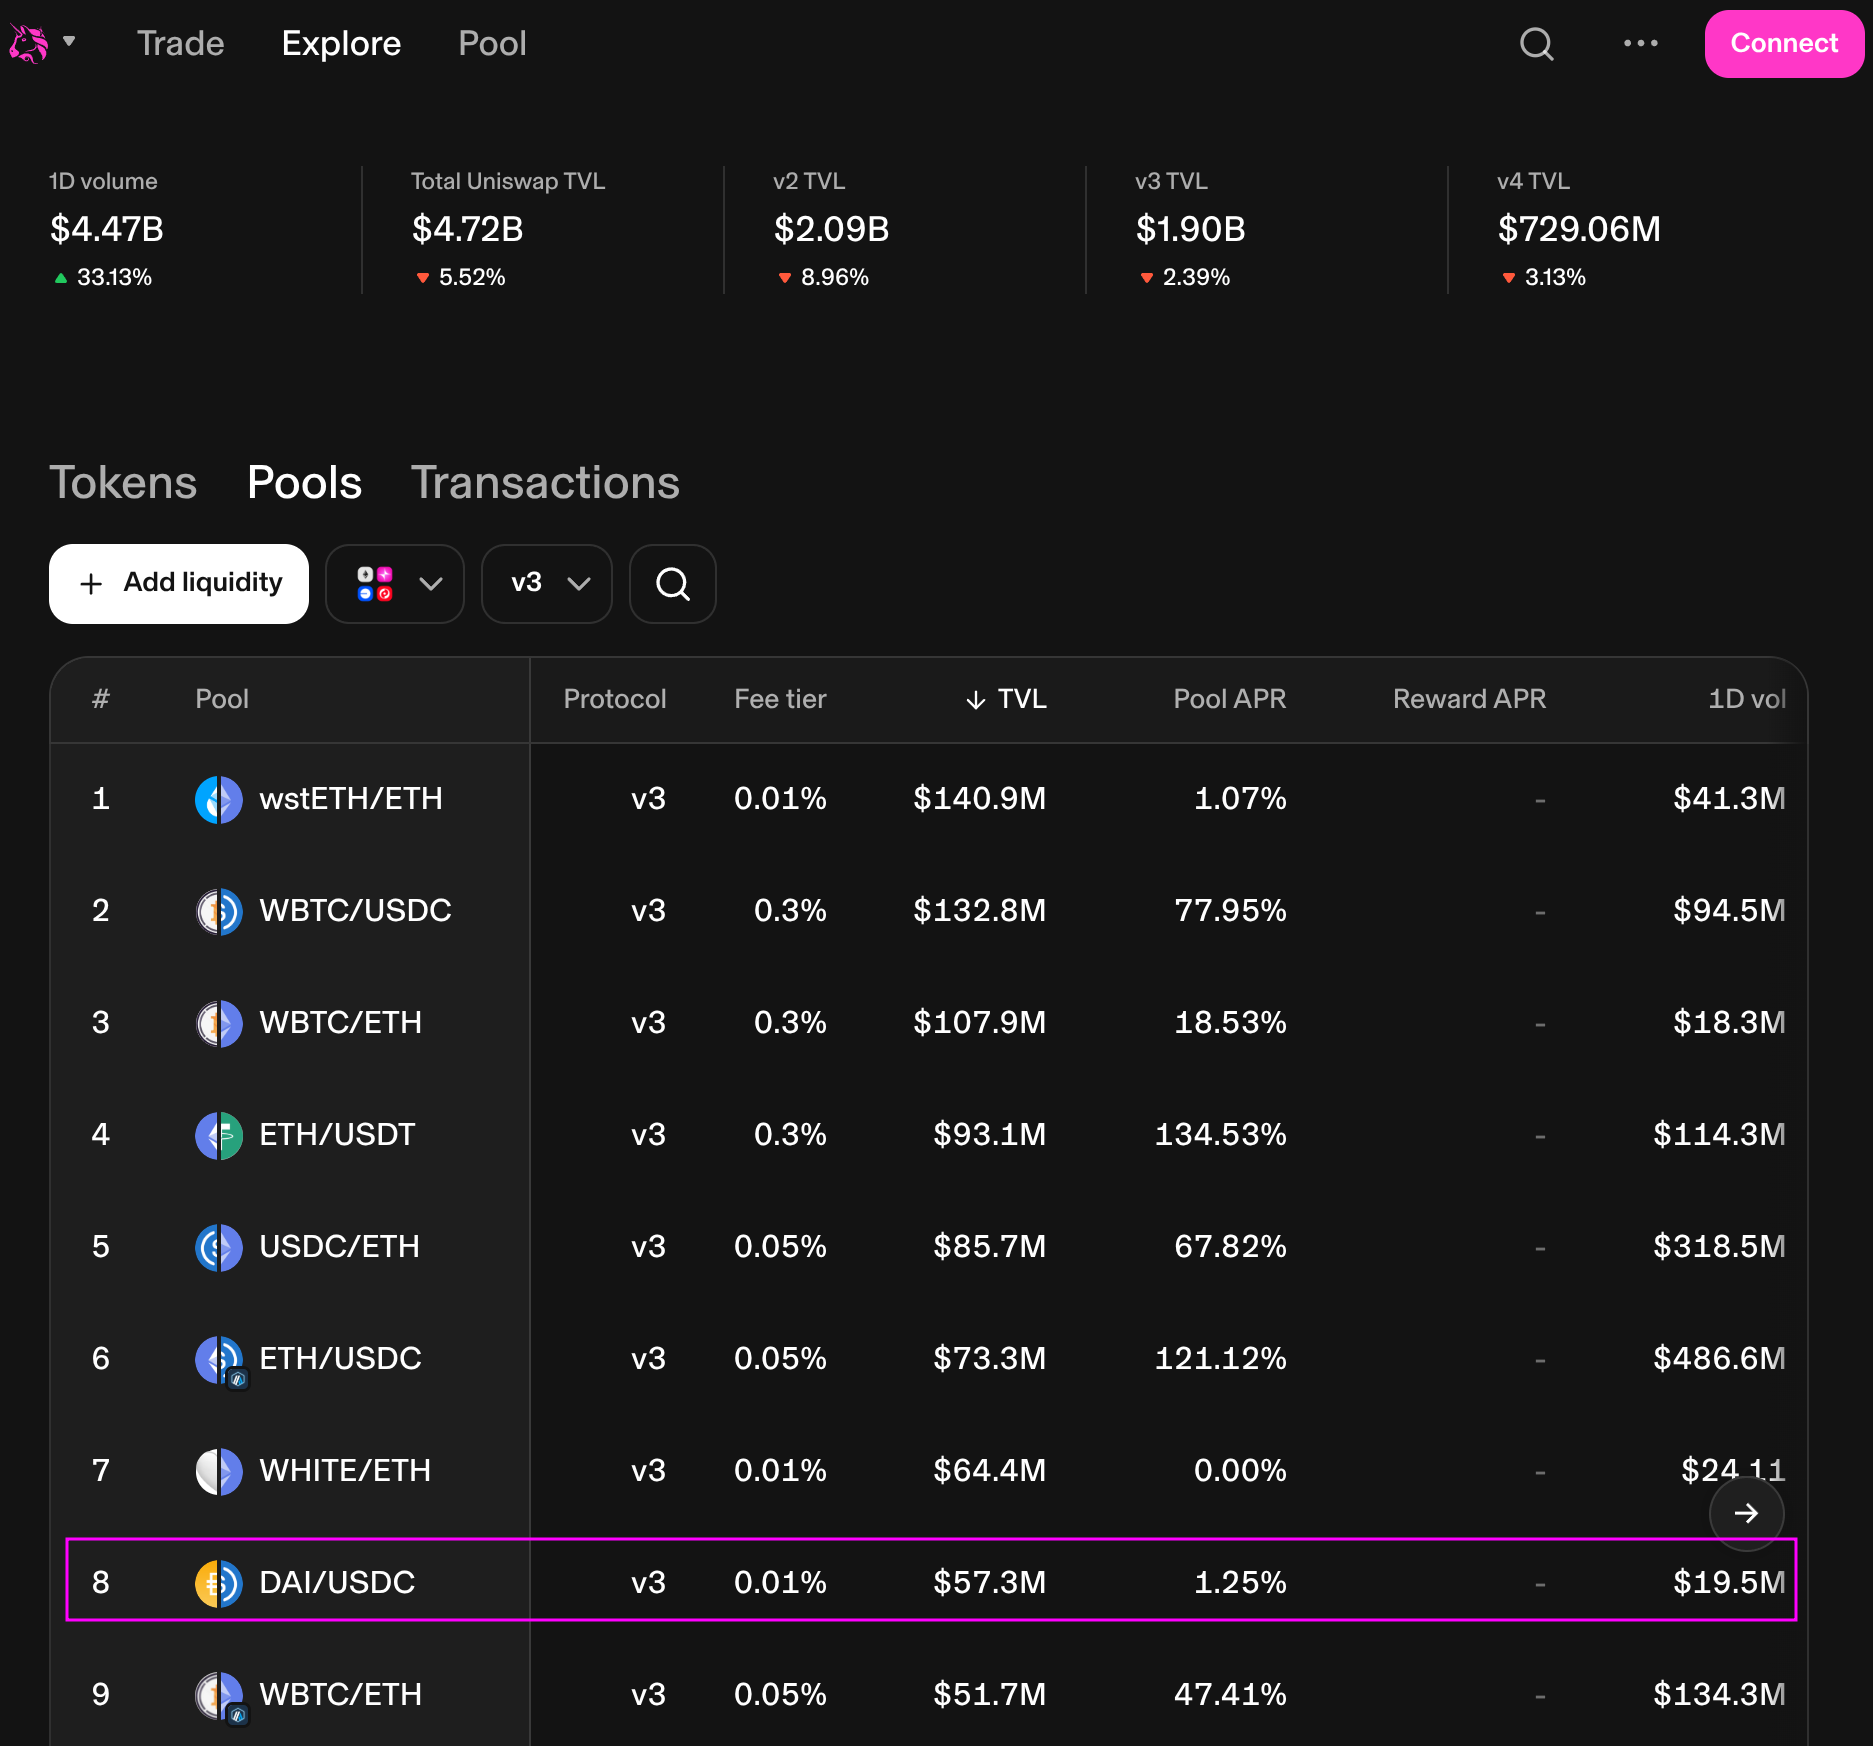
Selecting that pool reveals useful information about recent transactions, liquidity positions, volume, price, etc.
If you expand the time range and narrow the price range (click and drag on the y-axis) you will see that the price does exhibit mean-reverting behavior around a 1.0 ratio.
Unfortunately, the price scale is too coarse to give any real insight on the speed of the mean reversion or the degree of the volatility.
Where Does Price Come From?
Two key facts to recall from Part I:
Price is an expression of the instantaneous rate of exchange for a unit swap
Price can only change as the result of trade activity
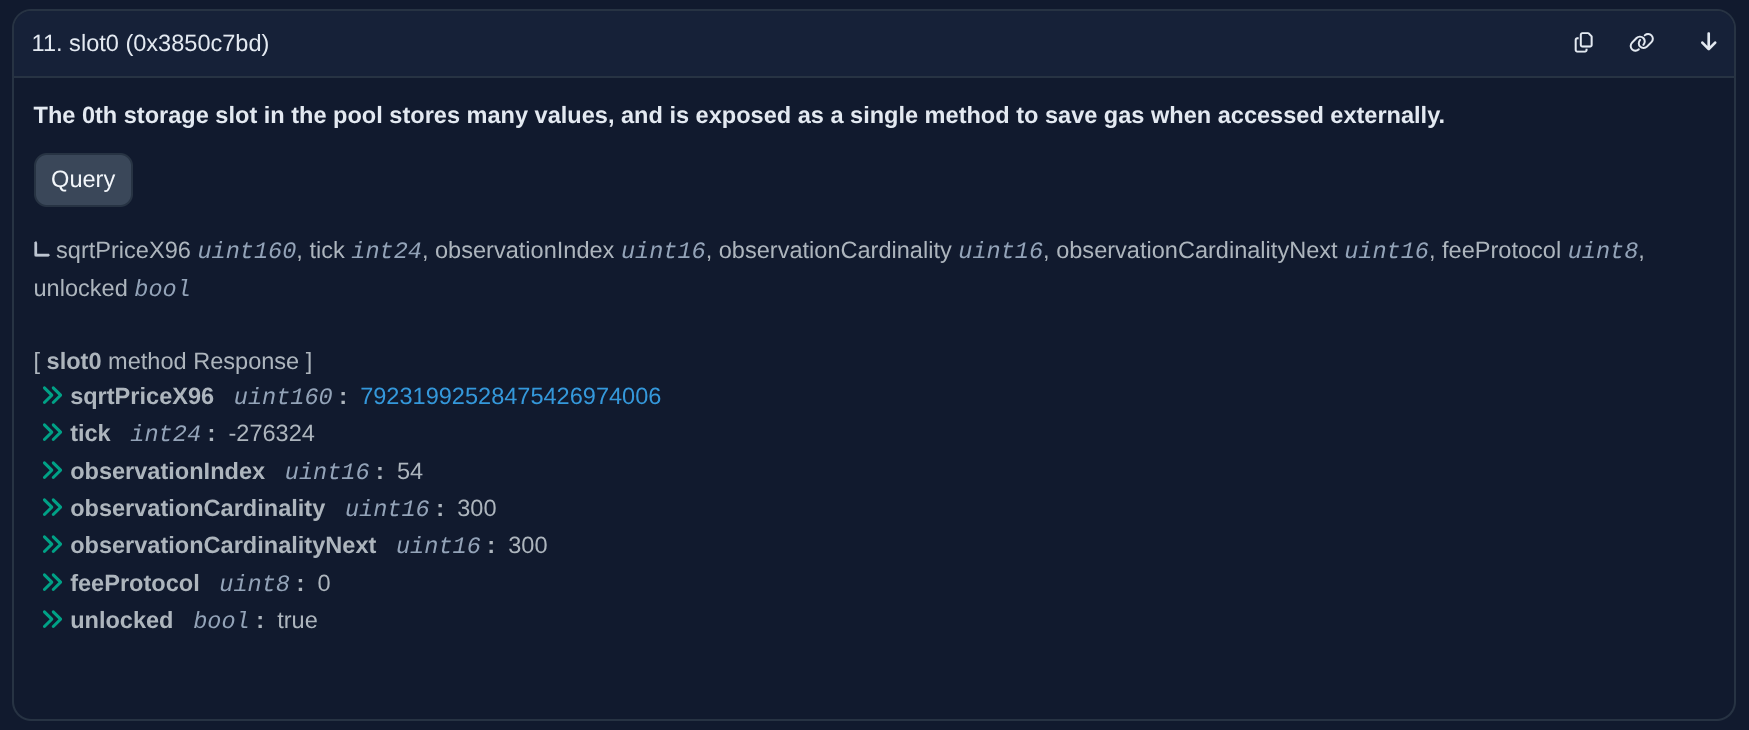
The price is tracked internally by the pool, and can be retrieved by calling a read-only function at the pool contract. If you click on the “0x5777…2168” text on the pool info, that will place the pool contract address in your clipboard. Visit that address on Etherscan and click the Read Contract sub-page on the Contract tab.
Scroll to the “slot0” function and click “Query” to find the current price: 79231992528475426974006.
If you expected the price to be somewhere near 1, that’s understandable. The hypothetical pool in Part II assumed that the decimals for both tokens were equal. Thus the price would be ~1.0, which corresponds to tick=0 center.
But USDC uses 6 decimal places instead of the more common 18. Thus, the onchain representation of “1 USDC” is 1,000,000. DAI uses the normal convention, so “1 DAI” is 1,000,000,000,000,000,000.
For this pool, DAI is marked as token0 and USDC is marked as token1. Thus the price, which always reflects token1/token0, is USDC/DAI.
Converting 79231992528475426974006 to an absolute ratio (shown in Part I) reveals that the current price is 1.0000966854881902 * 10^(-12) USDC/DAI.
The -12 exponent is intuitive, because DAI in the denominator has 12 more decimal places than USDC.
Since the absolute price < 1, we would expect the current tick to be negative. Inspecting slot0 confirms this: the tick is -276324.
Extracting DAI-USDC Price Data
For the remainder of the lesson, I will work in the ~/code/uniswap_v3_price_data folder on my machine. Scripts and extracted data will be stored there.
Whenever a trade occurs in a Uniswap V3 pool, an event is emitted by the contract. Etherscan shows the last 25 events on the Events tab, and you can search for particular events by their hash (marked as topic0) and/or block number:
These events are not stored onchain, but are emitted by the nodes that maintain the network. Some nodes record these events, and we can query them using the eth_getLogs RPC (remote procedure call).
eth_getLogs is the same call that Cryo uses to retrieve events from a remote provider.
The example below will use the free public endpoint provided by Llamanodes, but you can substitute any provider.
To retrieve the logs, pass a set of options to Cryo to filter for a given contract address, event hash, and signature. The signature allows Cryo to decode the event values instead of needing to do it ourselves:
btd@dev:~/code/uniswap_v3_price_data$ cryo logs --rpc https://eth.llamarpc.com --hex --u256-types string --chunk-size 1000000 --inner-request-size 1000 --contract "0x5777d92f208679DB4b9778590Fa3CAB3aC9e2168" --event "0xc42079f94a6350d7e6235f29174924f928cc2ac818eb64fed8004e115fbcca67" --event-signature "Swap(address indexed sender,add
ress indexed recipient, int256 amount0, int256 amount1, uint160 sqrtPriceX96, uint128 liquidity, int24 tick)"
There is a lot of data to retrieve and the endpoint has rate limits, so Cryo may work for an hour or more. Llamanodes allows for higher rate limits if you create an account and key, so I encourage you to do that if the free public service is taking too long.
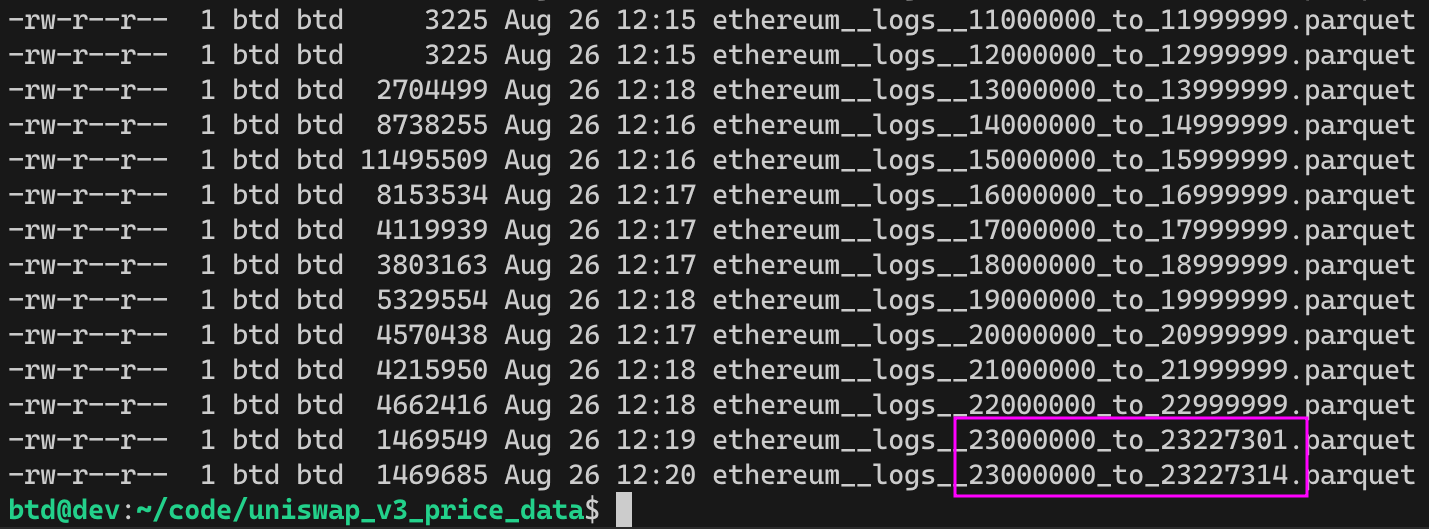
Once the extraction completes, the directory will be full of Parquet files with events from block 0 to the current chain height at the time you started. Cryo intelligently skips completed chunks on repeated runs, but ignores partial chunks. So if you run the data fetching step multiple times, be sure to remove the last partial chunk first! If you don’t, events for overlapping regions will appear in the data set twice and lead to simulation and analysis issues.
Notebook Exploration
I am using Marimo for the data exploration — feel free to use Jupyter if you prefer it.
